Mois Labs Beescale Yún#
Documentation | Source code | Licenses | Issues | Hiveeyes Project | Hiveeyes Community Forum
Tip
Please continue reading this document on our documentation space, all inline links will be working there.
About#
The second generation Mois Box is a beehive monitoring system based on the Arduino Yún Shield-compatible Dragino Yun Shield v2.4, running OpenWrt.
The article Bienenwaage 2.0 introduces you to the hardware setup.
Project repository#
@bee-mois is maintaining the full sources, including all auxiliary helper programs, within the beescale repository.
Pictures#
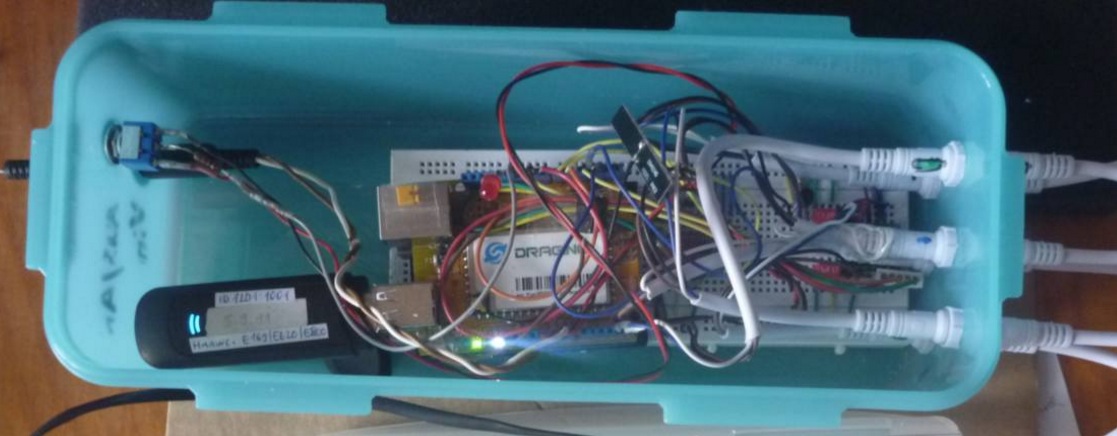

Hardware#
Board#
Sensors#
ADS1231 ADC weigh scale breakout board
DS18B20 digital thermometer
SHT30 digital humidity/temperature sensor
TSL25911 Ambient Light Sensor aka. Adafruit TSL2591 STEMMA QT High Dynamic Range Digital Light Sensor
Firmware#
The most recent firmware version is available at beescale-yun.ino.
Acquire source code#
# Acquire source code repository
git clone https://github.com/hiveeyes/arduino

# Select this firmware
cd arduino/moislabs/beescale-yun
Configure#
Have a look at the source code beescale-yun.ino and adapt feature flags and setting variables according to your environment.
Configure load cell calibration settings:
// Use sketches "scale-adjust-hx711.ino" or "scale-adjust-ads1231.ino" for calibration

// The raw sensor value for "0 kg"
const long loadCellZeroOffset = 38623;

// The raw sensor value for a 1 kg weight load
const long loadCellKgDivider  = 11026;
Tip
Please use the corresponding Firmwares for load cell adjustment to determine those values.
Build#
The build system is based on PlatformIO, which will install toolchains and build your customized firmware without efforts. All you need is a Python installation. If you want to use an IDE, we recommend to use the PlatformIO IDE.
make build
Upload to MCU#
export MCU_PORT=/dev/ttyUSB0
make upload
Tip
If you need to build for different targets, or if you want to modernize your dependencies,
you may want to adjust the platformio.ini file, to match your needs.
In order to make changes to the firmware, edit the beescale-yun.ino file, and
invoke make build to build it again.
Telemetry and backend#
Overview#
This flowchart will give you an idea how measurement data is acquired and processed within the sensor domain, and how it will be converged to the network and submitted to the backend systems.
Transport#
To get the measurement data from the sensor domain to the network, the Bridge Library for Yún devices enables communication between the ATmega328P MCU on the Arduino Uno, and the AR9331, running Linux. The library will enable transparent HTTP communication through the venerable Arduino HttpClient.
#include <Bridge.h>
#include <HttpClient.h>

HttpClient client;
client.post(url);
Using this HTTP client (example program at Yún HTTP Client), telemetry data is transmitted to a custom PHP receiver program, and is also stored on the SD card attached to the device.
Reception and relay#
On the backend, the PHP program receives the telemetry data record, and stores it into two different databases. First, it adds the record to a CSV file stored on the server’s file system, and second, it emits another HTTP request to the data acquisition server of our beekeepers collective at https://swarm.hiveeyes.org/.
To learn more about how this works, please visit the documentation about Daten zu Hiveeyes übertragen, and the Kotori message router and data historian.
Other than this, for publishing the webcam image, a cron job on the web server acquires the latest image from the Yun’s SD card every 15 minutes, and stores it on its own filesystem, where HTTP clients are able to consume it without further ado.
Visualization#
The data in the CSV file is visualized using the graph.php program. It uses dygraphs, a JavaScript charts framework, and that’s it.
On the other hand, when submitting data to Kotori on the collaborative data collection server at https://swarm.hiveeyes.org/, it will store the data into InfluxDB, and will populate a Grafana dashboard correspondingly.
Live data#
Contributions welcome#
You can run parts of this, or the whole system, on your own hardware, for yourselves, or as a service for your local beekeepers collective. If you want to report or fix a bug or documentation flaw, or if you would like to suggest an improvement, feel free to create an issue, or submit a patch. Thank you.
Note
echo "Viel Spaß am Gerät"
cat <<ZUSE

Es hat viele Erfinder außer mir gebraucht, um den Computer, so wie wir ihn heute kennen, zu entwickeln.
Ich wünsche der nachfolgenden Generation Alles Gute im Umgang mit dem Computer. Möge dieses Instrument
Ihnen helfen, die Probleme dieser Welt zu beseitigen, die wir Alten Euch hinterlassen haben.

-- Konrad Zuse

ZUSE